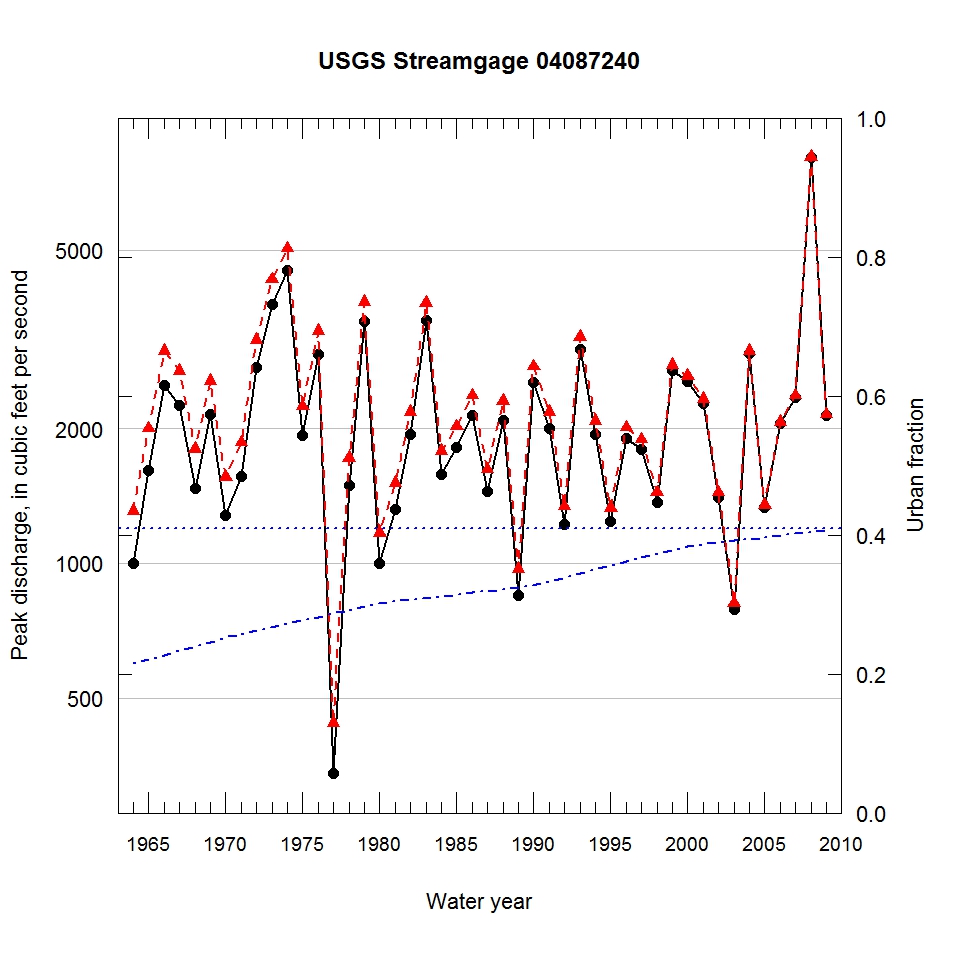
Observed and urbanization-adjusted annual maximum peak discharge and associated urban fraction and precipitation values at USGS streamgage:
04087240 ROOT RIVER AT RACINE, WI


| Water year | Segment | Discharge code | Cumulative reservoir storage (acre-feet) | Urban fraction | Precipitation (inches) | Observed peak discharge (ft3/s) | Adjusted peak discharge (ft3/s) | Exceedance probability |
| 1964 | 1 | -- | 115 | 0.215 | 2.713 | 997 | 1310 | 0.820 |
| 1965 | 1 | -- | 115 | 0.221 | 0.634 | 1610 | 2000 | 0.562 |
| 1966 | 1 | -- | 115 | 0.227 | 0.532 | 2500 | 2980 | 0.247 |
| 1967 | 1 | -- | 115 | 0.234 | 1.646 | 2250 | 2690 | 0.322 |
| 1968 | 1 | -- | 115 | 0.240 | 0.455 | 1470 | 1800 | 0.640 |
| 1969 | 1 | -- | 115 | 0.246 | 1.270 | 2150 | 2550 | 0.363 |
| 1970 | 1 | -- | 115 | 0.252 | 1.653 | 1280 | 1560 | 0.732 |
| 1971 | 1 | -- | 115 | 0.257 | 0.057 | 1560 | 1860 | 0.616 |
| 1972 | 1 | -- | 115 | 0.262 | 1.452 | 2740 | 3150 | 0.211 |
| 1973 | 1 | -- | 115 | 0.267 | 1.780 | 3790 | 4300 | 0.081 |
| 1974 | 1 | -- | 115 | 0.272 | 0.595 | 4500 | 5050 | 0.049 |
| 1975 | 1 | -- | 575 | 0.277 | 0.018 | 1930 | 2240 | 0.469 |
| 1976 | 1 | -- | 575 | 0.282 | 1.115 | 2930 | 3300 | 0.187 |
| 1977 | 1 | -- | 575 | 0.287 | 0.646 | 340 | 440 | 0.988 |
| 1978 | 1 | -- | 575 | 0.292 | 1.473 | 1490 | 1720 | 0.672 |
| 1979 | 1 | -- | 575 | 0.297 | 0.268 | 3460 | 3830 | 0.122 |
| 1980 | 1 | -- | 575 | 0.302 | 1.053 | 1000 | 1170 | 0.862 |
| 1981 | 1 | -- | 575 | 0.304 | 1.196 | 1320 | 1510 | 0.752 |
| 1982 | 1 | -- | 575 | 0.307 | 0.409 | 1940 | 2180 | 0.491 |
| 1983 | 1 | -- | 575 | 0.309 | 1.397 | 3480 | 3810 | 0.124 |
| 1984 | 1 | -- | 575 | 0.312 | 0.518 | 1580 | 1780 | 0.649 |
| 1985 | 1 | -- | 575 | 0.314 | 0.471 | 1810 | 2020 | 0.553 |
| 1986 | 1 | -- | 575 | 0.317 | 0.204 | 2140 | 2370 | 0.423 |
| 1987 | 1 | -- | 575 | 0.319 | 0.863 | 1450 | 1620 | 0.710 |
| 1988 | 1 | -- | 575 | 0.322 | 0.122 | 2090 | 2300 | 0.446 |
| 1989 | 1 | -- | 575 | 0.324 | 0.408 | 847 | 971 | 0.914 |
| 1990 | 1 | -- | 575 | 0.327 | 1.247 | 2530 | 2750 | 0.305 |
| 1991 | 1 | -- | 575 | 0.333 | 1.011 | 2000 | 2180 | 0.490 |
| 1992 | 1 | -- | 575 | 0.338 | 0.742 | 1220 | 1340 | 0.808 |
| 1993 | 1 | -- | 575 | 0.344 | 1.268 | 3010 | 3200 | 0.201 |
| 1994 | 1 | -- | 575 | 0.350 | 0.947 | 1940 | 2080 | 0.530 |
| 1995 | 1 | -- | 575 | 0.356 | 1.289 | 1240 | 1330 | 0.811 |
| 1996 | 1 | -- | 575 | 0.361 | 0.986 | 1900 | 2010 | 0.558 |
| 1997 | 1 | -- | 575 | 0.367 | 1.134 | 1800 | 1890 | 0.606 |
| 1998 | 1 | -- | 575 | 0.373 | 0.828 | 1370 | 1440 | 0.776 |
| 1999 | 1 | -- | 575 | 0.379 | 1.105 | 2690 | 2770 | 0.297 |
| 2000 | 1 | -- | 575 | 0.384 | 1.810 | 2550 | 2620 | 0.343 |
| 2001 | 1 | -- | 575 | 0.387 | 1.158 | 2270 | 2330 | 0.437 |
| 2002 | 1 | -- | 575 | 0.389 | 0.915 | 1400 | 1440 | 0.776 |
| 2003 | 1 | -- | 575 | 0.392 | 0.523 | 789 | 814 | 0.943 |
| 2004 | 1 | -- | 575 | 0.394 | 1.857 | 2940 | 2980 | 0.246 |
| 2005 | 1 | -- | 575 | 0.397 | 0.344 | 1330 | 1350 | 0.805 |
| 2006 | 1 | -- | 575 | 0.399 | 1.009 | 2050 | 2070 | 0.531 |
| 2007 | 1 | -- | 575 | 0.402 | 1.035 | 2350 | 2370 | 0.422 |
| 2008 | 1 | -- | 575 | 0.404 | 3.065 | 8050 | 8080 | 0.012 |
| 2009 | 1 | -- | 575 | 0.407 | 1.698 | 2140 | 2150 | 0.503 |

